

facebook twitter instagram linkedin google youtube vimeo tumblr yelp rss email podcast phone blog search brokercheck brokercheck Play Pause
%POST_TITLE% Thumbnail

July 2026 Monthly Market Commentary

July 2026 Monthly Market Commentary

Strong Earnings Meet Slower Growth and Renewed Energy Risk


EXECUTIVE SUMMARY

Markets finished July with mixed results as strong corporate earnings and continued investment in artificial intelligence were offset by slower economic growth, renewed energy-price pressure, and a more divided Federal Reserve. The S&P 500 was approximately flat for the month after a volatile path, while smaller companies remained one of the stronger areas year-to-date. Fixed income continued to provide income, but Treasury yields moved higher late in the month as oil prices and inflation concerns resurfaced. July reinforced the central tension of 2026: corporate fundamentals remain constructive, but the macroeconomic margin for error has narrowed.


Market Review

Asset Class Performance – Trailing Returns as of 07/31/2026
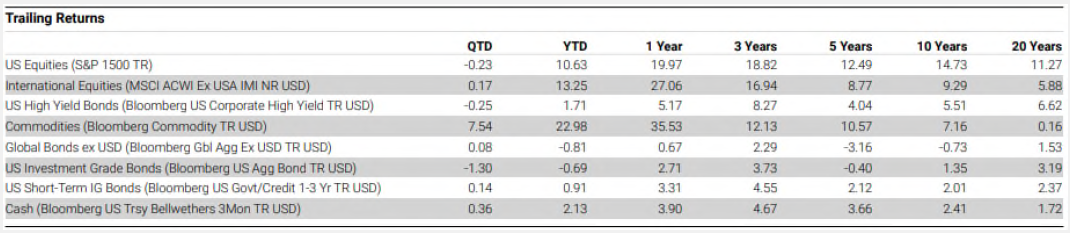
Source: Morningstar; Returns for periods longer than 1 year are annualized.

July was a month of sharp crosscurrents. U.S. equities were supported by an unusually strong start to second-quarter earnings season, particularly among technology, communication-services, and energy companies. At the same time, geopolitical developments in the Middle East pushed oil prices higher and revived concerns that inflation could remain above the Federal Reserve's objective for longer than expected.

Market leadership became less uniform. Large-cap indexes finished close to unchanged, while smaller companies preserved strong year-to-date gains despite uneven performance late in the month. International markets were mixed as currency movements, energy costs, and regional policy differences created greater dispersion. The overall result was a market that rewarded selectivity more than broad risk-taking. 


Economic Update

Key Economic Indicators
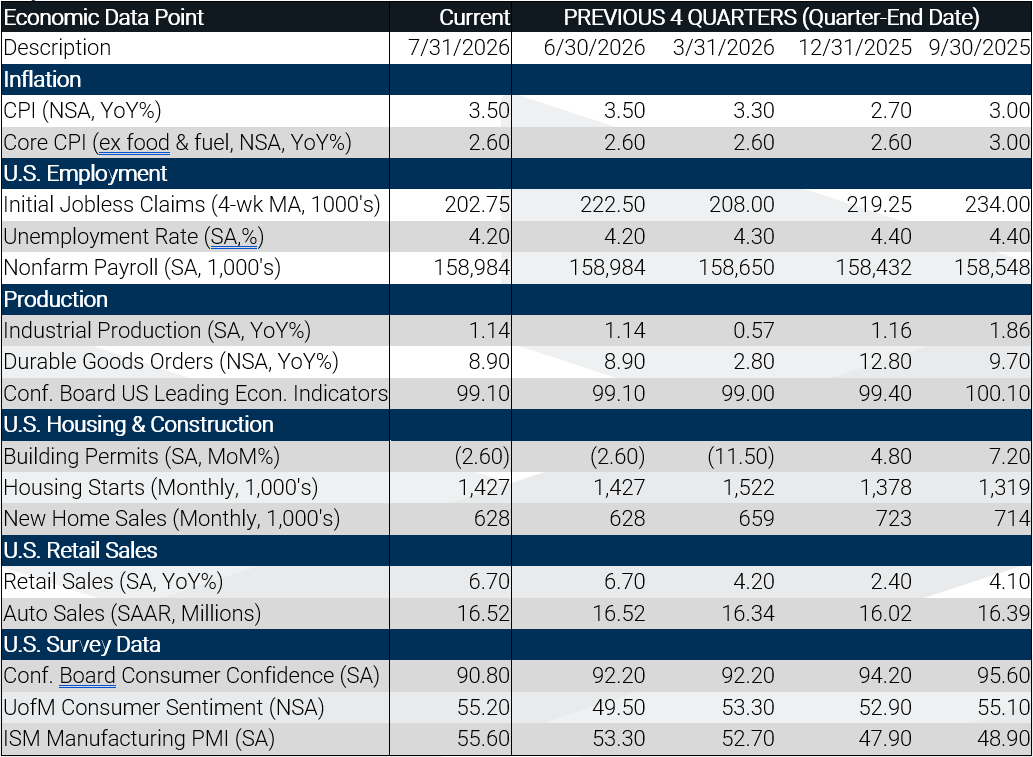
Source: Bloomberg

The economy continued to expand, but at a slower pace. The advance estimate showed real gross domestic product increased at a 1.5% annual rate in the second quarter, supported by consumer spending and investment but restrained by trade and other volatile components. The latest available labor report showed payroll growth of 57,000 in June and an unemployment rate of 4.2%, indicating a labor market that remained stable but had clearly cooled from earlier in the cycle.

Inflation remained above target. June consumer prices were 3.5% higher than a year earlier, with energy costs a significant contributor. The Federal Reserve's preferred personal-consumption inflation measure was 3.7% year over year in June, while the core measure was 3.3%. Although monthly inflation readings improved from May, the level remained too high for policymakers to declare victory. 


Federal Reserve

At its July meeting, the Federal Reserve maintained the federal funds target range at 3.50% to 3.75%. The decision was notable because three voting members dissented in favor of a quarter-point rate increase. The unusually divided vote underscored the challenge facing policymakers: growth is slowing and the labor market is cooling, but inflation remains elevated and energy-related supply risks have intensified.

The Fed's reaction function is therefore becoming more balanced and less predictable. Further easing would likely require clearer evidence that inflation is moving sustainably lower, while a persistent energy shock could renew discussion of tighter policy. Investors should expect incoming data to remain highly influential for both bond yields and equity valuations.


Equity Markets

Corporate earnings were the primary support for equities. Through the end of July, second-quarter results were running well ahead of expectations, aided by strong profitability among several mega-cap companies and continued spending on artificial-intelligence infrastructure. Earnings breadth was also encouraging, with multiple sectors contributing to profit growth rather than a single narrow group.

Even with strong fundamentals, valuation discipline became more important. The largest U.S. companies remained highly sensitive to capital-spending expectations and any disappointment in forward guidance. Smaller companies continued to offer broader participation in domestic growth, but remained more exposed to borrowing costs and refinancing conditions. International equities retained valuation advantages, although higher energy prices created a more difficult backdrop for energy-importing economies.


Diversifying Strategies 

Energy markets were a major source of volatility and diversification. Oil prices rose sharply during July as renewed U.S.-Iran tensions, disruptions around the Strait of Hormuz, and attacks affecting regional shipping increased supply concerns. These developments supported energy-related assets but also raised the risk that higher fuel costs could slow consumer spending and complicate the inflation outlook.

Precious metals, infrastructure, and other real assets remained relevant as investors balanced geopolitical risk against slower economic growth. Private credit continued to offer income potential, but the environment favored disciplined underwriting and careful attention to liquidity. July again demonstrated that diversifiers can contribute through both return generation and differentiated sensitivity to macroeconomic shocks.

Fixed Income

Fixed income continued to generate meaningful income, but July illustrated why the path of total returns may remain uneven. Treasury yields were influenced by softer growth data early in the month and then moved higher as oil prices rose and the Federal Reserve signaled continued concern about inflation. The result was modest pressure on longer-duration bonds late in July.

Investment-grade corporate credit remained supported by healthy earnings and balance sheets. High-yield bonds continued to benefit from attractive coupons and relatively contained default expectations, although tight spreads reduced the cushion against weaker growth or renewed risk aversion. The income component of fixed income remains valuable, but interest-rate sensitivity and credit selection continue to matter.

Outlook

Theme #1: Earnings Remain a Key Support 

Strong corporate profitability continues to provide a constructive foundation for equities, even as valuations require greater selectivity.

Theme #2: Growth is Moderating

Second-quarter GDP and labor data suggest continued expansion, but at a slower and less uniform pace.

Theme #3: Inflation Has Not Been Defeated

Improvement in monthly data is encouraging, but year-over-year inflation remains above the Federal Reserve's objective.

Theme #4: Energy Risk has Re-emerged

Oil prices and geopolitical supply disruptions now represent a more important risk to both growth and inflation.

Theme #5: Diversification Remains Essential

Greater dispersion across sectors, regions, and asset classes increases the value of maintaining multiple return drivers.


Conclusion

July presented a more complicated market environment than the first half of the year. Corporate earnings remained strong, artificial-intelligence investment continued to support activity, and financial conditions were generally stable. However, slower economic growth, persistent inflation, and renewed energy-market disruption reduced the margin for disappointment.

We remain constructive on the long-term outlook while recognizing that the balance of risks has become less favorable. Market returns are likely to remain uneven and more dependent on earnings quality, valuation, and sensitivity to interest rates and energy costs. A disciplined approach centered on strategic asset allocation and thoughtful diversification remains appropriate as investors navigate the second half of 2026. 


Download Article


Important Disclosures
Please remember that past performance may not be indicative of future results.  Different types of investments involve varying degrees of risk, and there can be no assurance that the future performance of any specific investment, investment strategy, or product (including the investments and/or investment strategies recommended or undertaken by MCF), or any non-investment related content, made reference to directly or indirectly in this newsletter will be profitable, equal any corresponding indicated historical performance level(s), be suitable for your portfolio or individual situation, or prove successful.  Due to various factors, including changing market conditions and/or applicable laws, the content may no longer be reflective of current opinions or positions. Moreover, you should not assume that any discussion or information contained in this newsletter serves as the receipt of, or as a substitute for, personalized investment advice from MCF.  To the extent that a reader has any questions regarding the applicability of any specific issue discussed above to his/her individual situation, he/she is encouraged to consult with the professional advisor of his/her choosing.    MCF is neither a law firm nor a certified public accounting firm and no portion of the newsletter content should be construed as legal or accounting advice.  A copy of the MCF’s current written disclosure statement discussing our advisory services and fees is available upon request. If you are a MCF client, please remember to contact MCF, in writing, if there are any changes in your personal/financial situation or investment objectives for the purpose of reviewing/evaluating/revising our previous recommendations and/or services.
MCF Advisors, LLC ("MCF") is an SEC registered investment adviser. MCF may only transact business in those states in which it is registered, or qualifies for an exemption or exclusion from registration requirements. This brochure is limited to the dissemination of general information pertaining to MCF's advisory services. Accordingly, this brochure should not be construed by any consumer and/or prospective client as MCF's solicitation to effect, or attempt to effect transactions in securities, or the rendering of personalized advice from MCF. Please remember that different types of investments involve varying degrees of risk, and there can be no assurance that the future performance of any specific investment or investment strategy (including those undertaken or recommended by MCF), will be profitable or equal any historical performance level(s). To the extent that a reader has any questions regarding the applicability of any content discussed herein to his/her individual situation, he/she is encouraged to consult with the professional advisor of his/her choosing. MCF is neither a law firm nor a certified public accounting firm and no portion of the brochure content should be construed as legal or accounting advice. A copy of MCF's current written disclosure statement discussing our advisory services and fees is available upon request.
Market Commentary Disclosure: This is prepared for informational purposes only. It does not address specific investment objectives, or the financial situation and the particular needs of any person who may receive this report.
Index Disclosure: An index is an unmanaged portfolio of specific securities, the performance of which is often used as a benchmark in judging the relative performance of certain asset classes. Investors cannot invest directly in an index. An index does not charge management fees or brokerage expenses, and no such fees or expenses were deducted from the performance shown. 
Third Party Source Disclosure: The information herein was obtained from various sources. MCF does not guarantee the accuracy or completeness of information provided by third parties. The information in this report is given as of the date indicated and believed to be reliable. MCF assumes no obligation to update this information, or to advise on further developments relating to it.
Allocation Portfolios comprised of the following index weightings rebalanced daily: Balanced: 35.75% S&P 1500 Composite TR USD, 19.25% MSCI ACWI ex-USA IMI NR USD, 8.00% Bloomberg Gbl Agg Ex USD TR USD, 8.00% Bloomberg US Corporate High Yield TR USD, 4.00% Bloomberg Commodity TR USD, 12.50% Bloomberg Agg Bond TR USD, 12.5% Bloomberg US Govt/Credit 1-3 Yr TR USD
Index returns shown are total-return (TR), which reflect the inclusion of dividends and other earnings. Index returns obtained from Morningstar and Bloomberg. Investors cannot invest in an index. Indexes are unmanaged and do not reflect the deduction of any fees or expenses, which would reduce returns. 
In the event that there has been a change in a client's investment objectives or financial situation, he/she is encouraged to advise MCF immediately.  Different types of investments and/or investment strategies involve varying levels of risk, and there can be no assurance that any specific investment or investment strategy (including the investments purchased and/or investment strategies devised or undertaken by MCF) will be either suitable or profitable for a client's or prospective client's portfolio. No part of this letter is considered to be tax advice; please consult a tax advisor or accountant for tax advice. A copy of MCF's current written disclosure statement discussing its advisory services and fees is available upon request. ANY QUESTIONS: MCF's Chief Compliance Officer, Timothy A. Gavin, remains available to address any questions that you may have.
US Broad Market Equities: The S&P Composite 1500® combines three leading indices, the S&P 500®, the S&P MidCap 400®, and the S&P SmallCap 600®, to cover approximately 90% of U.S. market capitalization. It is designed for investors seeking to replicate the performance of the U.S. equity market or benchmark against a representative universe of tradable stocks.
Large Cap Equities: The S&P 500 Composite Index is a market capitalization-weighted index of 500 widely held stocks often used as a proxy for the stock market. It measures the movement of the largest issues. Standard and Poor's chooses the member companies for the 500 based on market size, liquidity and industry group representation. Included are the stocks of industrial, financial, utility, and transportation companies.
Mid Cap Equities: Standard and Poor's Midcap 400 Index is a capitalization-weighted index which measures the performance of the mid-range sector of the U.S. stock market. The index was developed with a base level of 100 as of December 31, 1990.
Small Cap Equities: The Standard & Poor's Smallcap 600 Index is a capitalization-weighted index that measures the performance of selected U.S. stocks with a small market capitalization. The index was developed with a base value of 100 as of December31, 1993.
International Developed Equities: The MSCI World ex-USA IMI NR USD Index measures the performance of the large, mid, and small cap segments of world, excluding US equity securities. It is free float-adjusted market-capitalization weighted. The index consists of the following 22 developed market country indexes: Australia, Austria, Belgium, Canada, Denmark, Finland, France, Germany, Hong Kong, Ireland, Israel, Italy, Japan, the Netherlands, New Zealand, Norway, Portugal, Singapore, Spain, Sweden, Switzerland, and the United Kingdom. The index is presented as net total return, which includes the reinvestment of dividends after the deduction of withholding taxes, using (for international indexes) a tax rate applicable to non-resident institutional investors who do not benefit from double taxation treaties.
EM Equities: The MSCI Emerging Markets IMI NR USD Index is a free float-adjusted market capitalization index (includes large, mid, and small cap) that is designed to measure equity market performance of emerging markets. The MSCI Emerging Markets Index consists of the following 23 emerging market country indexes: Brazil, Chile, China, Colombia, Czech Republic, Egypt, Greece, Hungary, India, Indonesia, Korea, Malaysia, Mexico, Peru, Philippines, Poland, Qatar, Russia, South Africa, Taiwan, Thailand, Turkey* and United Arab Emirates. The index is presented as net total return, which includes the reinvestment of dividends after the deduction of withholding taxes, using (for international indexes) a tax rate applicable to non-resident institutional investors who do not benefit from double taxation treaties.
Commodities: The Bloomberg Commodity TR USD Index measures the performance of future contracts on physical commodities which traded on US exchanges and London Metal Exchange. The commodity weightings are based on production and liquidity, subject to weighting restrictions applied annually.
High Yield Bonds: The Bloomberg US Corporate High-Yield TR USD Index measures the market of USD-denominated, non-investment grade, fixed-rate, taxable corporate bonds. Securities are classified as high yield if the middle rating of Moody’s, Fitch, and S&P is Ba1/BB+/BB+ or below, excluding emerging market debt.
Global/International Bonds: The Bloomberg Global Agg ex USD TR USD Index measures the performance of global investment grade fixed-rate debt markets that excludes USD-dominated securities.
Core/Agg Bonds: The Bloomberg US Aggregate Bond TR USD Index is a broad-based flagship benchmark that measures the investment grade, US dollar-denominated, fixed-rate taxable bond market. The index includes Treasuries, government-related and corporate securities, MBS (agency fixed-rate and hybrid ARM pass-through), ABS and CMBS (agency and non-agency). Provided the necessary inclusion rules are met, US Aggregate eligible securities also contribute to the multi-currency Global Aggregate Index and the US Universal Index, which includes high yield and emerging markets debt.
Muni Bonds: The Bloomberg US Municipal TR USD Index covers the USD-denominated long-term tax-exempt bond market. The index has four main sectors: state and local general obligation bonds, revenue bonds, insured bonds, and prerefunded bonds.
TIPS Bonds: The Bloomberg US Treasury Inflation-Protected Securities (TIPS) TR USD Index is a rules-based, market value-weighted index that tracks inflation-protected securities issued by the U.S. Treasury. The U.S. TIPS Index is a subset of the Global Inflation-Linked Index, with a 38.5% market value weight in the index (as of December 31, 2010), but is not eligible for other nominal Treasury or Aggregate indices. To prevent the erosion of purchasing power, TIPS are indexed to the non-seasonally adjusted Consumer Price Index for All Urban Consumers, or the CPI-U (CPI).
Short-Term Bonds:  The Bloomberg US Government/Credit 1-3 Year TR USD Index measures the performance of non-securitized component of the U.S. Aggregate Index with maturities of 1-3 years, including Treasuries, government-related issues and corporates. It is a subset of the U.S. Aggregate Index.
Cash: The prefunded Bloomberg US Treasury Bellwethers 3-Month TR USD Index measures the performance of six on-the-run U.S. Treasuries that reflect the most recently issued 3m securities. It follows Barclays Capital’s index monthly rebalancing conventions.
Inflation: The Consumer Price Index for All Urban Consumers (CPI-U), calculated by BLS, provides a measure of the average change in the prices paid by urban consumers for a fixed market basket of goods and services relative to the price of that basket during the 1982-1984 period. The U.S. index is based on the prices of goods and services, including food and beverages, housing, apparel, transportation, medical care, recreation, education, and communication, that people buy for day-to-day living in urban areas across the country. U.S. data are published in the monthly BLS news release, Consumer Price Index. The index is seasonally adjusted.